Checkout errors rise at 14:07. CPU looks normal. The most recent deployment finished at 14:02. That timeline creates a useful hypothesis, not a verdict.
The first objective is to reduce customer harm while preserving enough evidence to explain what happened. A calm workflow makes each action answer a specific question.
Establish impact before diagnosis
Write down the affected operation, start time, error and latency changes, regions or tenants involved, and whether the failure is total or partial. Separate user symptoms from infrastructure alarms. A low CPU graph does not demonstrate a healthy request path.
Declare ownership and a communication channel. Assign an incident lead when the response involves multiple people. Record timestamps, observations, hypotheses, changes, and outcomes. Keep secrets and customer payloads out of shared transcripts.
Sketch the failing path
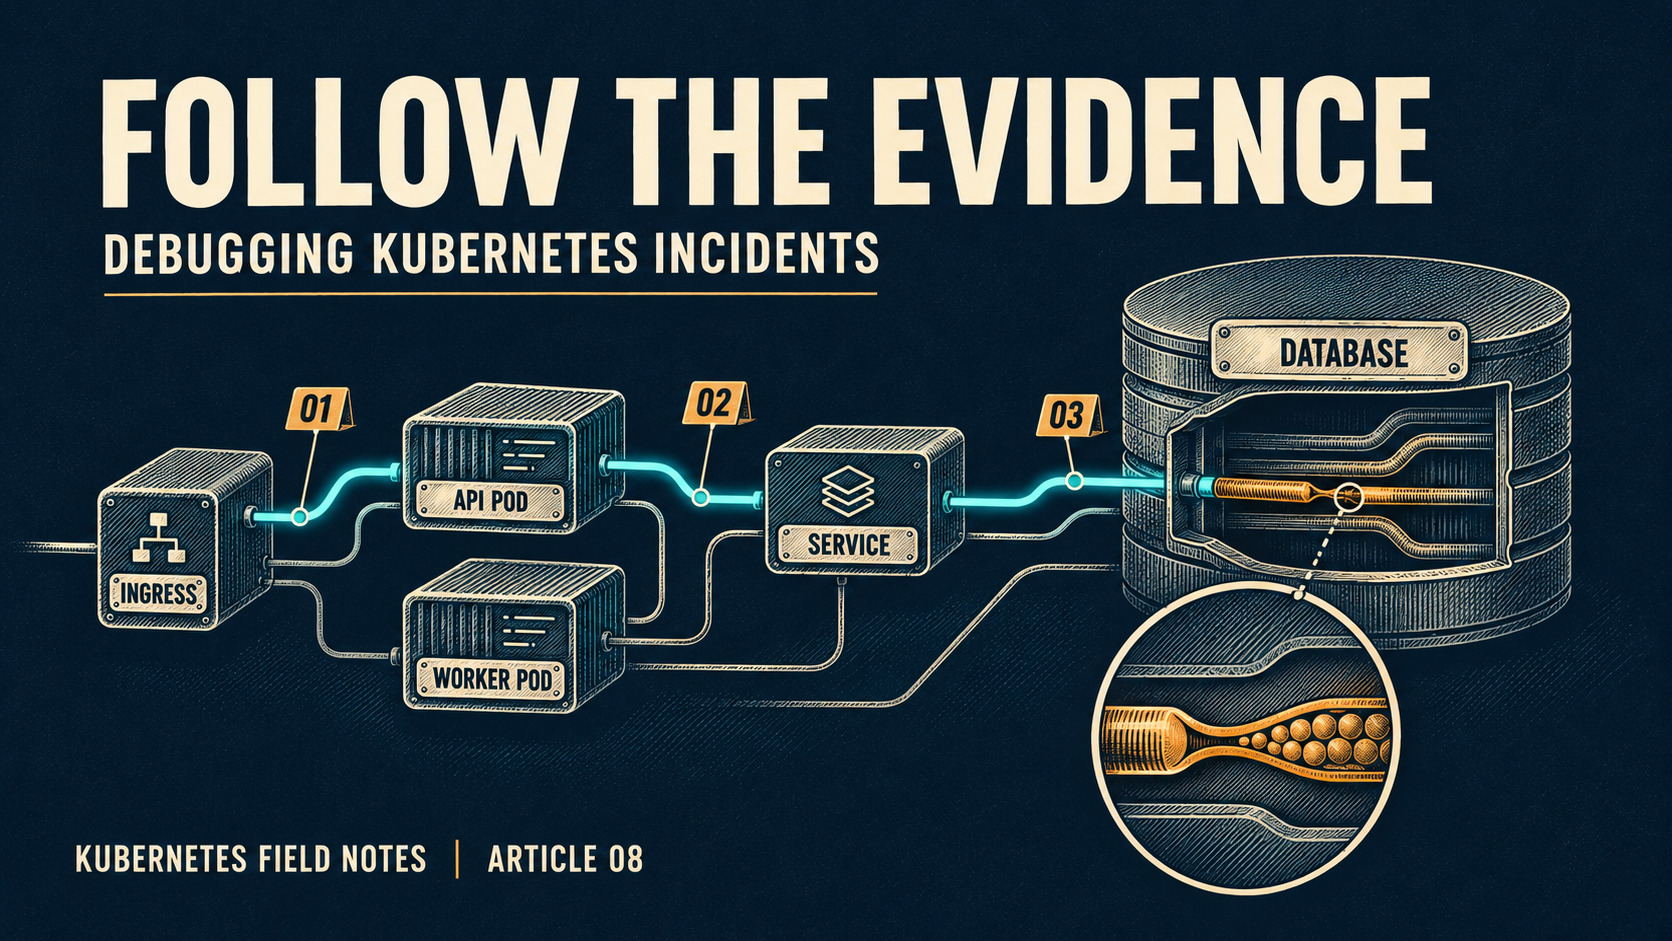
For a synchronous request, a useful first sketch is client → edge/load balancer → Gateway or Ingress → Service → endpoint → application → database or external dependency. A queue worker has a different path: producer → broker → consumer → completion or acknowledgement.
Choose the path users are actually traversing. A successful health endpoint request does not prove checkout works. An internal request does not prove external DNS and TLS work. A synthetic request that bypasses authorization can miss an application failure.
Find the first useful divergence
Compare failing and successful requests in the same period. Does the failure correlate with a version, node, zone, endpoint, tenant, route, or dependency? Look at p95 and p99 latency, error categories, throughput, queue age, and saturation rather than averages alone.
Use request or trace IDs to connect observations across services. A downstream span that is slow narrows the investigation, but still leaves questions: server execution, connection acquisition, DNS, TLS, retry amplification, and network delay can all contribute.
Classify the Kubernetes evidence
| Observation | Next evidence | What it does not prove |
|---|---|---|
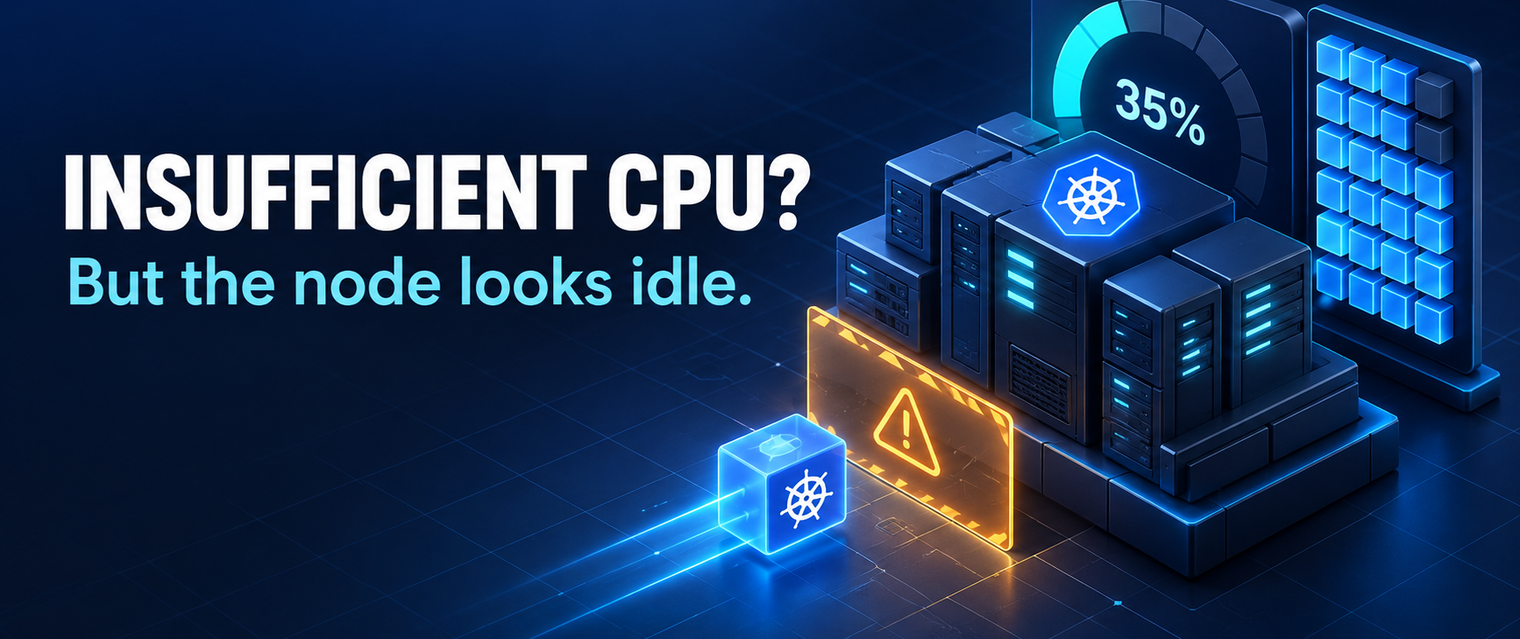
| Pending Pod | Scheduling events, requests, constraints, volumes | That all nodes are using all CPU |
| Waiting container | Waiting reason, image pull and configuration events | That the application started |
| Restarting container | Previous logs, termination reason, exit code | That more replicas will help |
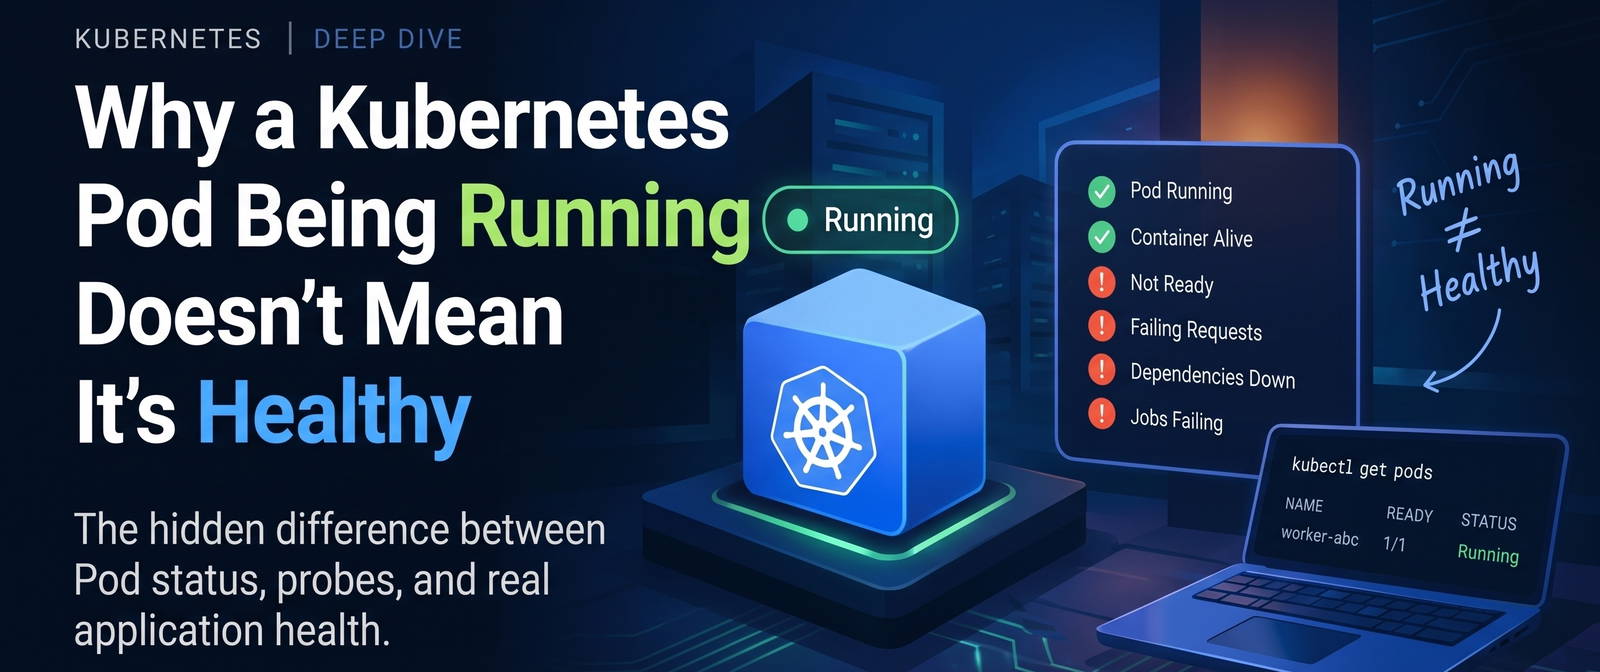
| Running but unready | Probe output, listener, startup and dependencies | That restarting is the correct recovery |
| Ready but failing requests | Request traces, routing, application and downstream metrics | That Kubernetes must be the root cause |
kubectl -n shop get pods -o wide
kubectl -n shop describe pod checkout-example
kubectl -n shop logs checkout-example -c api --since=15m --timestamps
kubectl -n shop logs checkout-example -c api --previous --timestamps
kubectl -n shop get events --sort-by=.metadata.creationTimestamp
kubectl -n shop get endpointslices -l kubernetes.io/service-name=checkout -o yaml
Replace names with observed resources. Previous logs apply when a prior container instance exists. Events and logs have retention limits. Capture relevant evidence promptly, without treating their absence as proof that nothing happened.
Experiment: investigate a hidden fault
The incident lab gives you a symptom and several read-only investigations. Each reveals an observation. Form a hypothesis before choosing a mitigation, then compare your action with the hidden scenario. Switching scenarios resets the evidence trail.
The goal is not to memorize a command. It is to choose the observation that best separates competing explanations. The lab is intentionally small; real incidents can contain multiple simultaneous faults.
Mitigate with a prediction
Before an action, state the expected result and the observation window. For example: shifting traffic away from the new revision should reduce version-correlated errors within a few minutes if the old revision remains compatible. If it does not, update the hypothesis.
Scaling application replicas can make a saturated database worse. Restarting a Pod can erase transient evidence and briefly restore a symptom without resolving its cause. Rolling back code may be unsafe after a schema change. Choose the smallest reversible action supported by evidence and the incident's urgency.
Safety and investigation can proceed together. If impact is severe and a known safe mitigation exists, use it while another responder gathers evidence. Avoid making several unrelated changes at once; that makes both recovery and causal analysis harder to interpret.
Verify recovery from the user's side
Confirm error rate, tail latency, and completed work across the affected cohorts. Check backlog recovery and downstream saturation. A green Deployment and a cleared alert are useful but incomplete evidence. Watch for recurrence over an observation window appropriate to the failure mode.
After recovery, distinguish trigger, contributing conditions, detection gaps, and response delays. Turn findings into concrete improvements: a better readiness contract, a bounded retry policy, a rollout gate, a permission test, or telemetry that separates connection wait from query execution.
Close the series loop
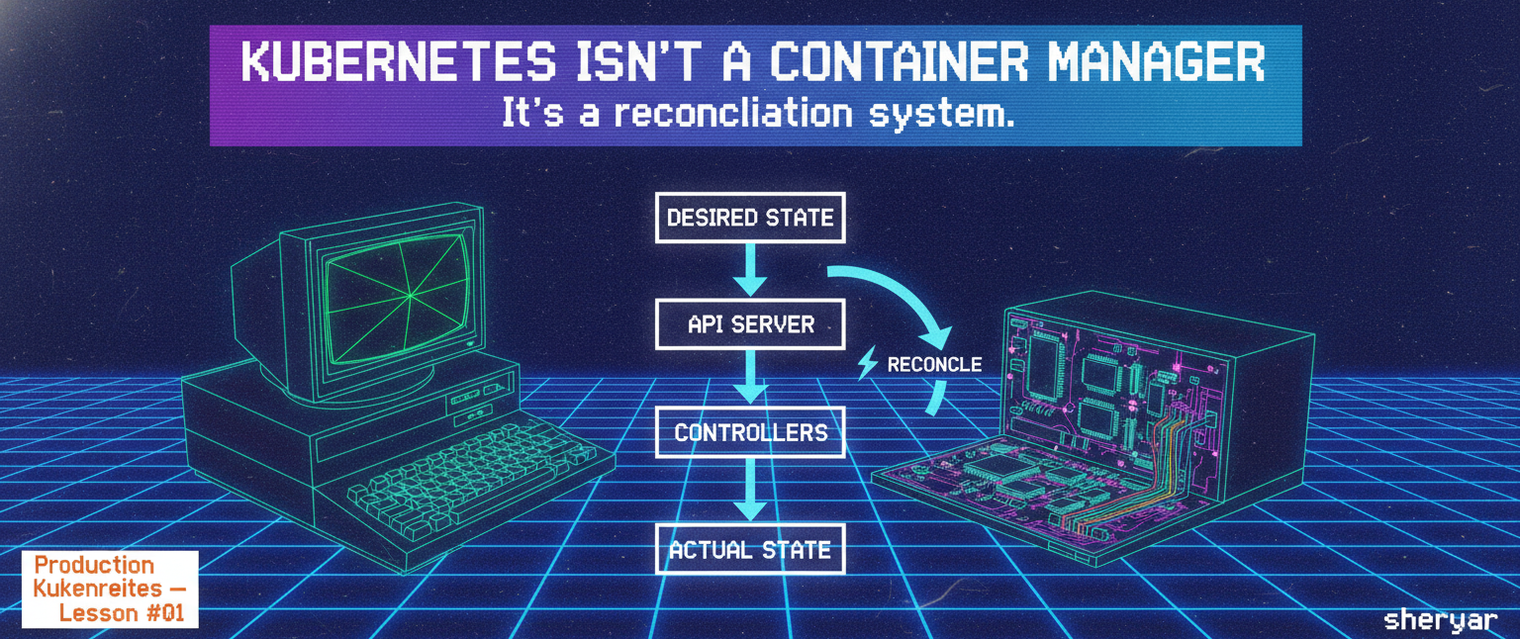
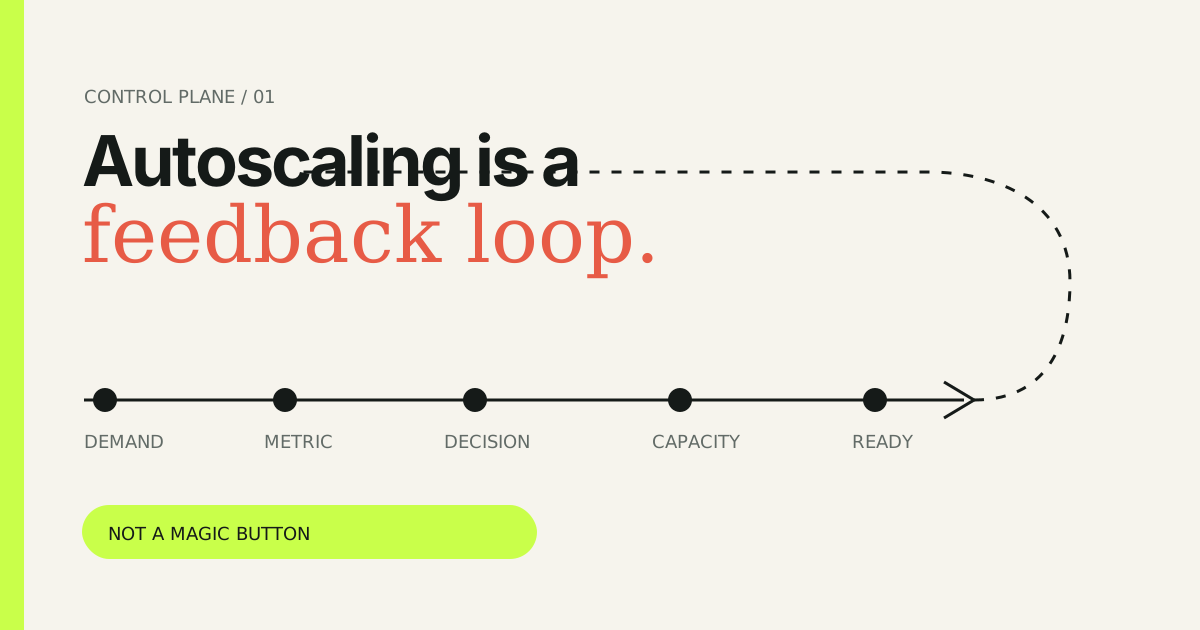
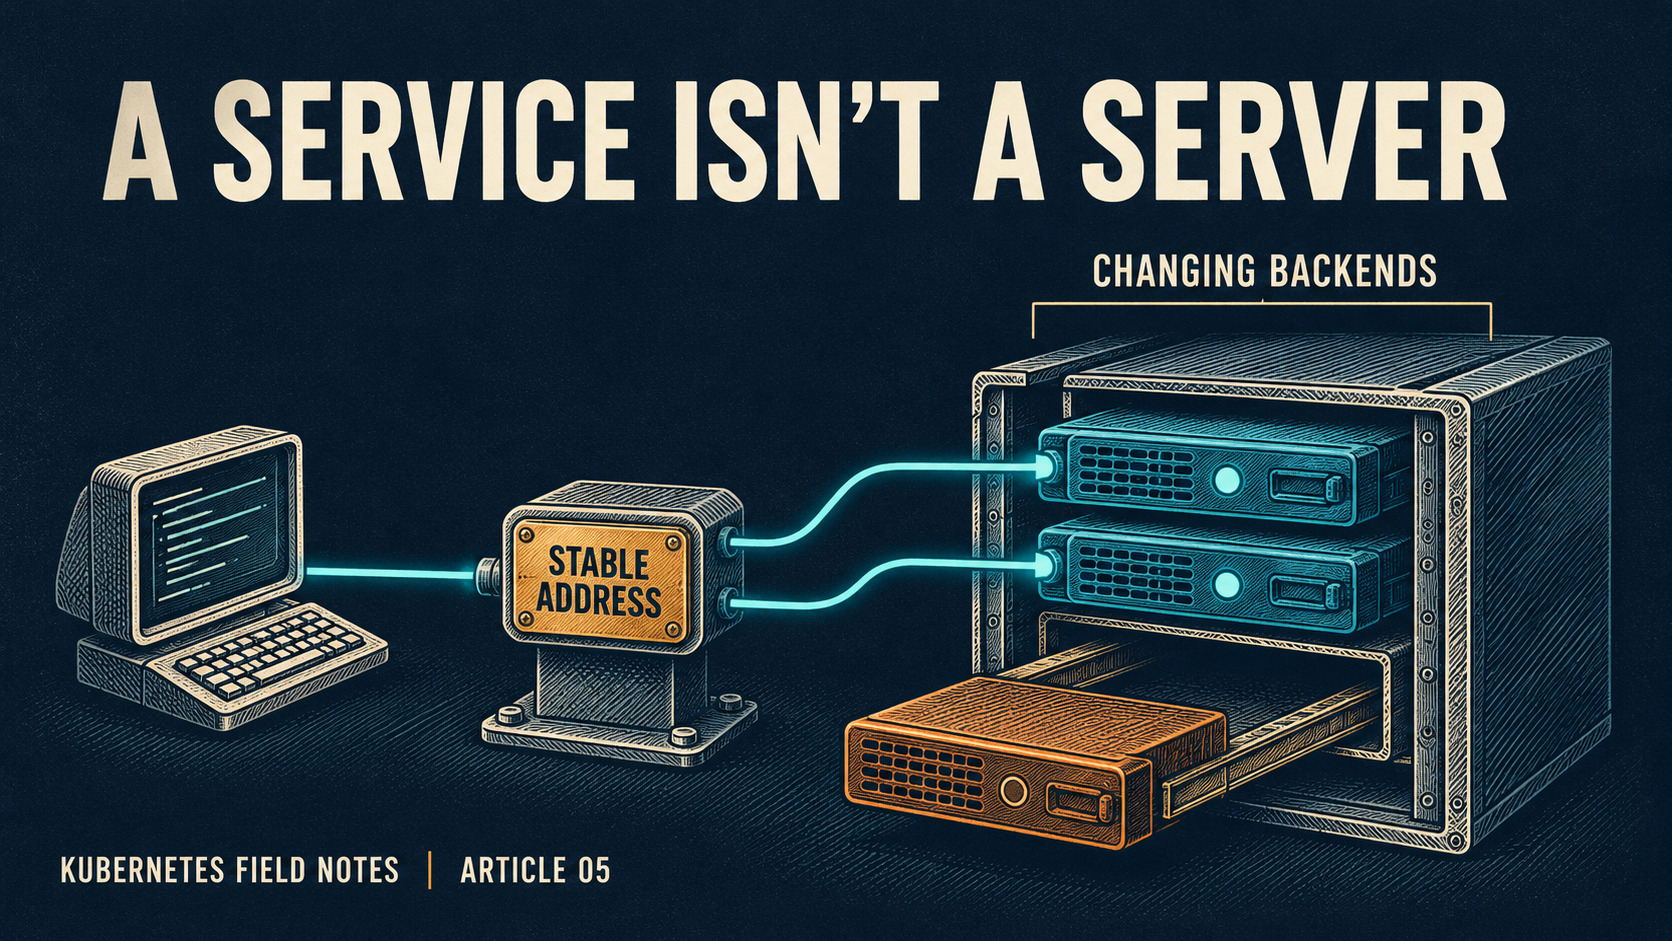
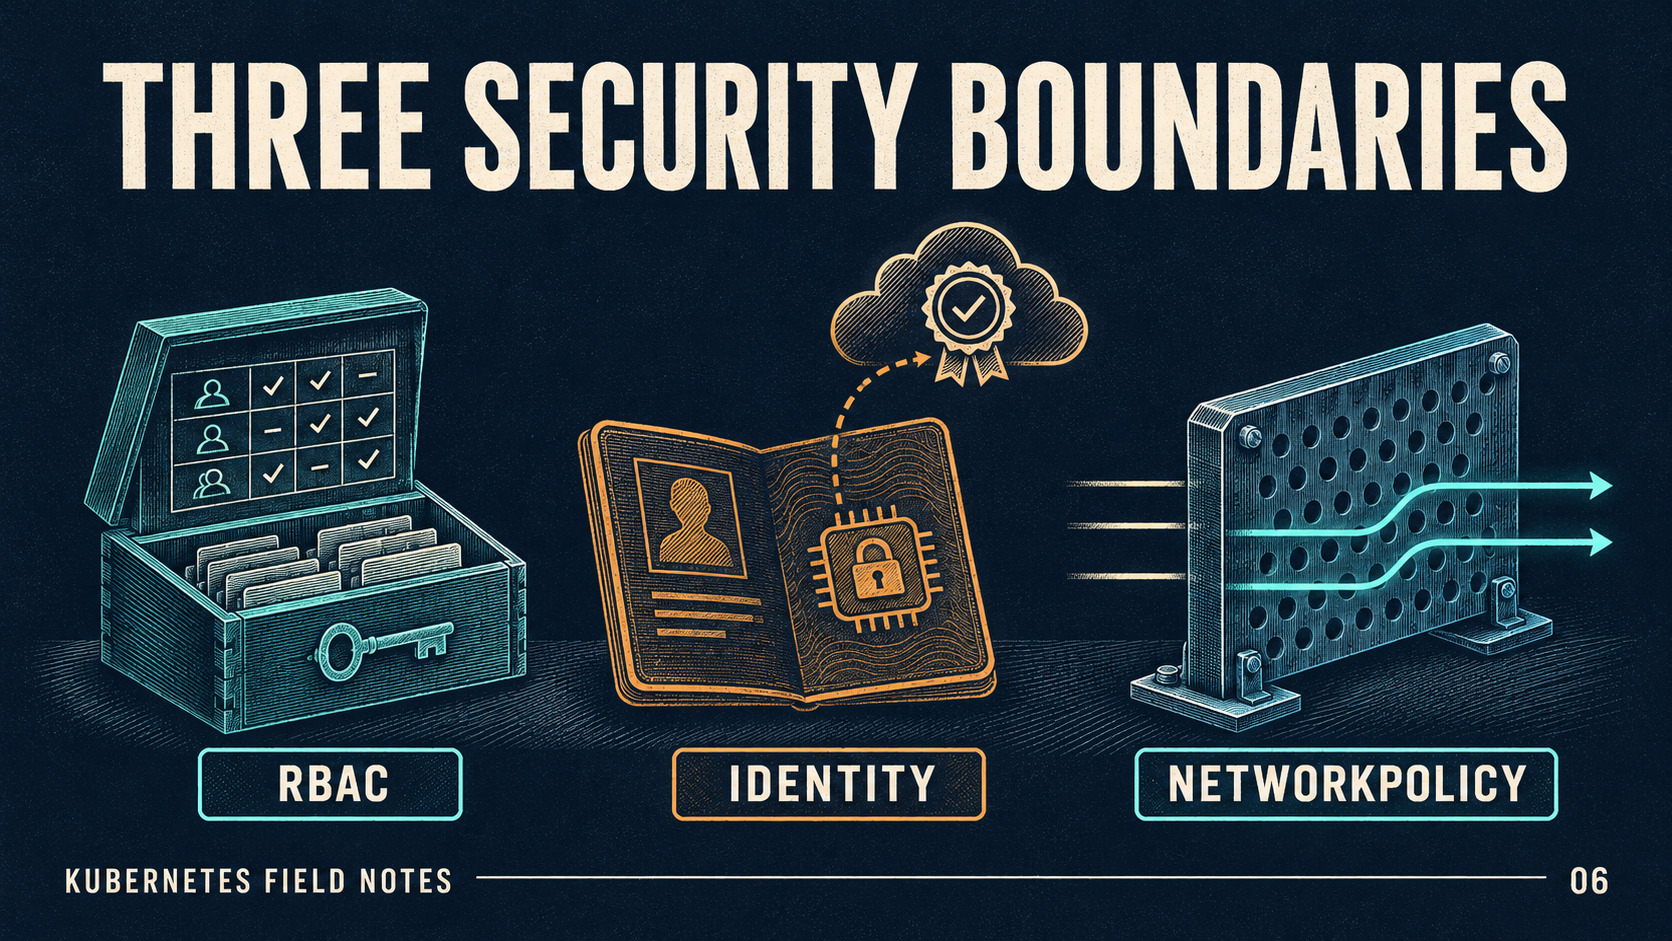
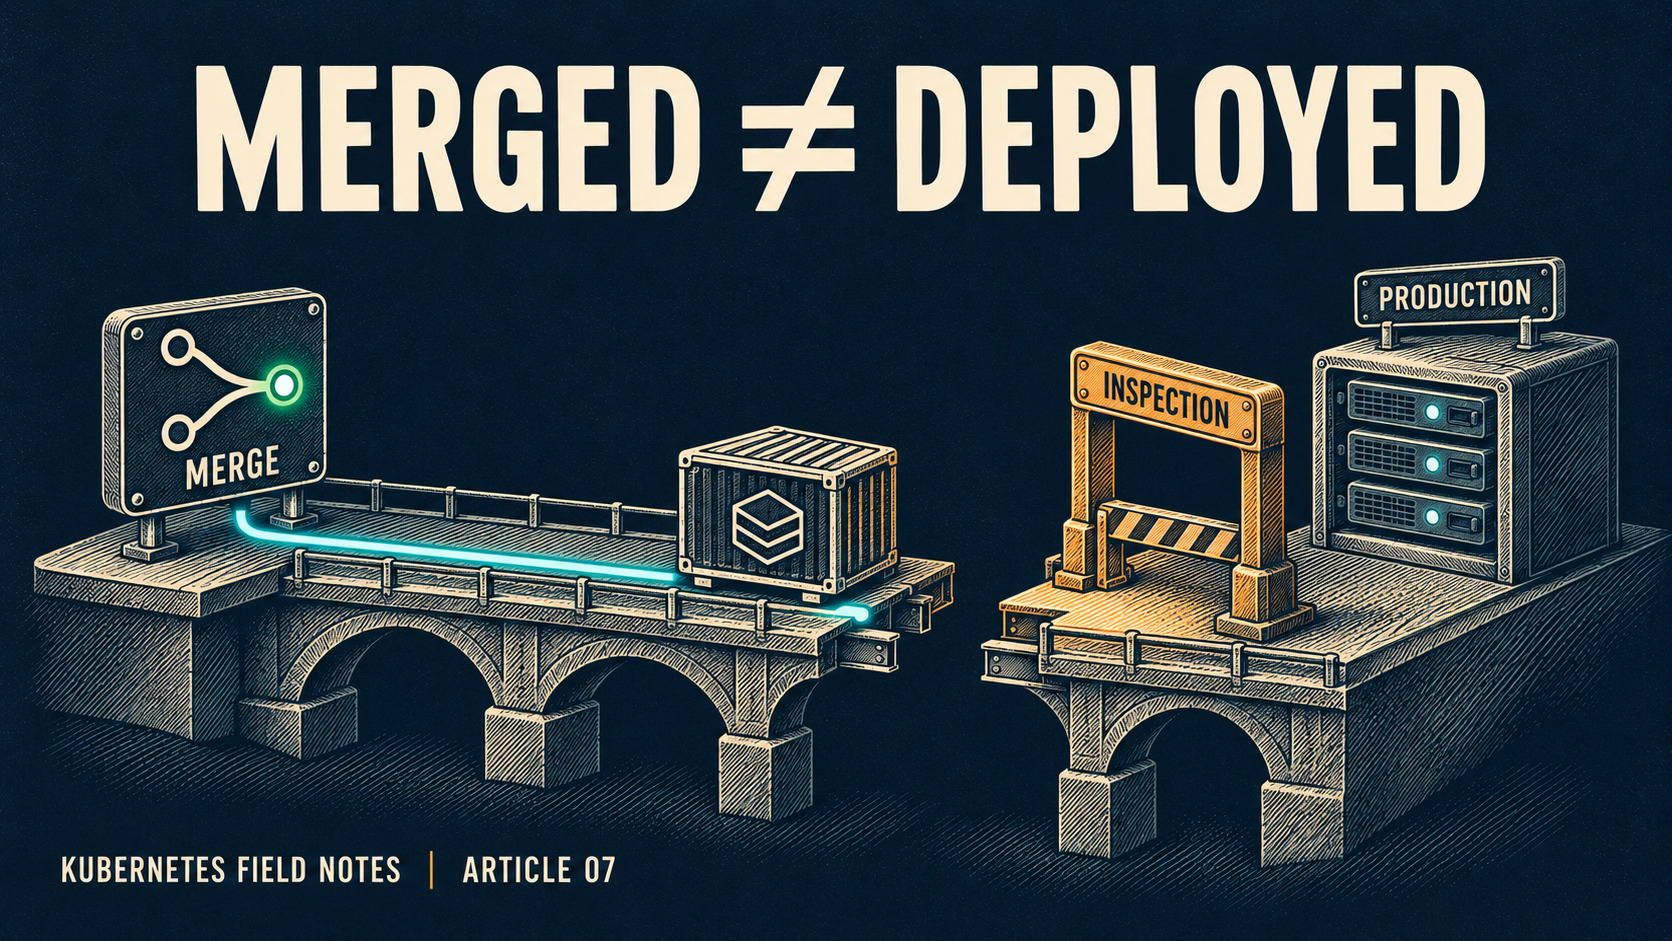
Reconciliation describes intent. Health describes eligibility. Scheduling describes placement. Autoscaling describes delayed capacity. Services describe routing. Security describes permission. Delivery describes version movement. Incident response connects those boundaries to the experience users actually have.
The question I keep returning to is: what should happen next, who owns that handoff, and what evidence shows why it cannot happen?
Sources and scope
The scenarios are fictional teaching examples, not claims about incidents I have operated. The response sequence is an engineering workflow rather than a Kubernetes guarantee.